Cancer pathway mapping can turn a complicated genomic report into something much easier to understand. A comprehensive tumor report may contain a long list of altered genes, variant names, biomarkers, and classifications. But simply knowing which genes are abnormal does not necessarily explain what the cancer is doing.
The more important question is how those abnormal genes interact.
Cancer pathway mapping takes individual genomic alterations and places them into the biological signaling systems that control cancer growth, survival, metabolism, blood supply, immune escape, and treatment resistance.
Instead of asking only, “Which genes are mutated?” pathway mapping asks a more useful question:
Which cellular control systems have been altered, and how are those systems connected?
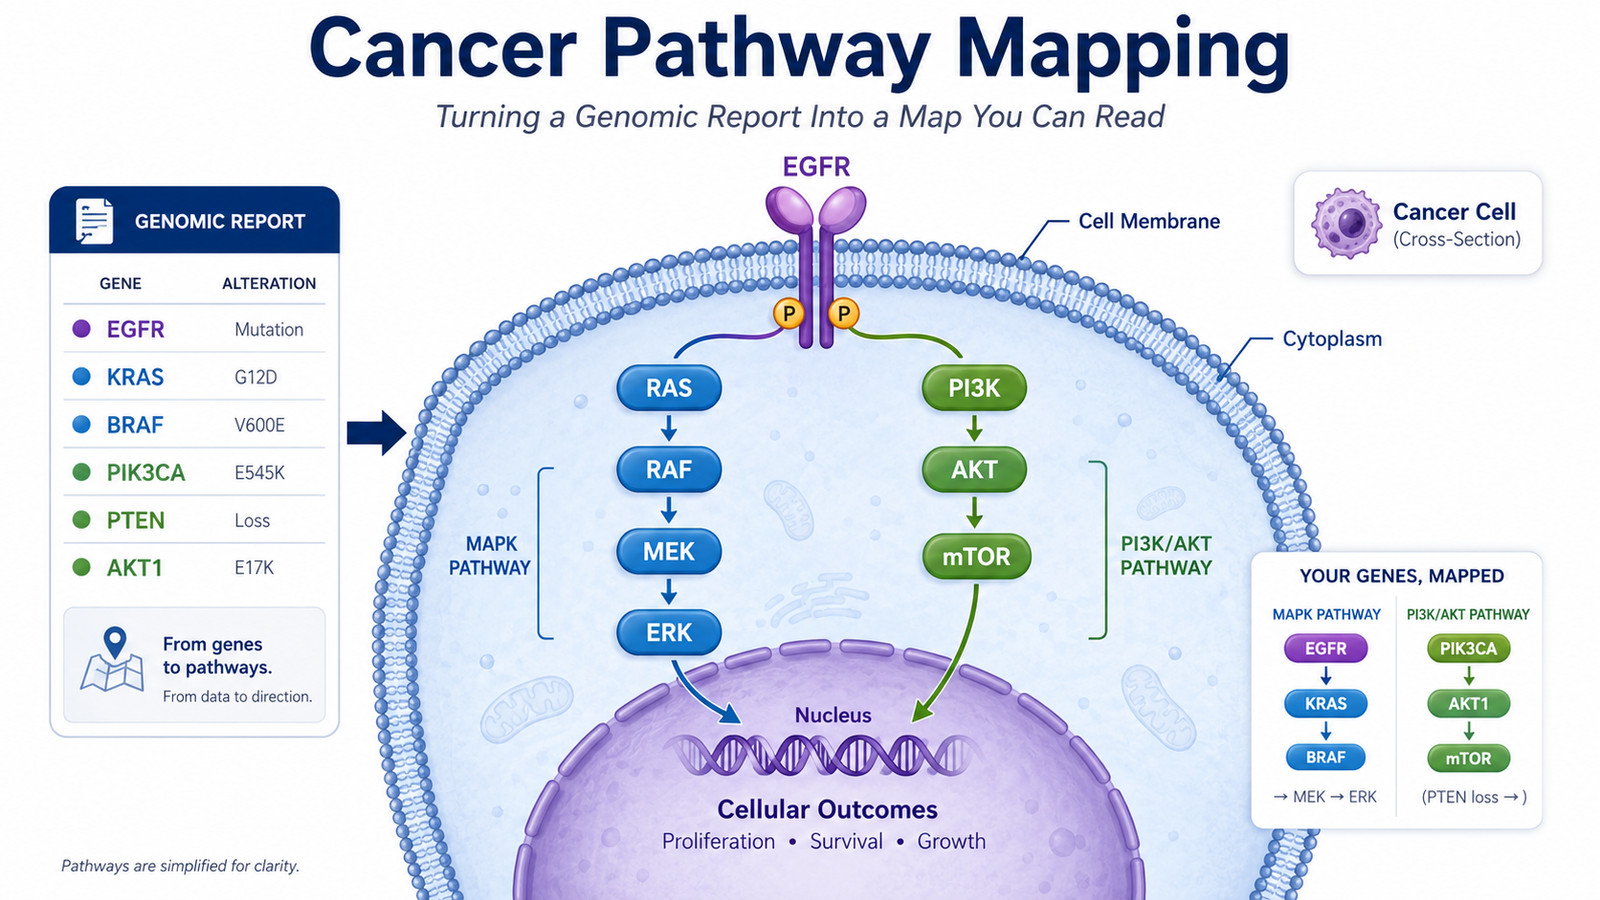
How Cancer Pathway Mapping Works
Genes rarely act alone.
Cells operate through signaling pathways. A signal may begin at a receptor on the surface of the cell. That signal is then transmitted through several proteins inside the cell before ultimately affecting gene expression in the nucleus.
Think of it as a relay.
An alteration at one point in the relay may have consequences throughout the entire pathway.
This produces two clinically important principles.
First, different mutations can produce a similar biological effect.
For example, alterations involving EGFR, RAS, RAF, MEK, and ERK may affect different positions along the same growth signaling pathway.
Second, the location of an alteration within a pathway can determine whether targeting another part of that pathway is likely to work.
A classic example occurs in colorectal cancer.
EGFR is positioned upstream of RAS. When a colorectal cancer contains an activating RAS mutation, the downstream growth signal may remain active even if EGFR is inhibited. This is why RAS testing became essential when determining whether certain patients with metastatic colorectal cancer are candidates for anti EGFR antibodies such as cetuximab or panitumumab.
The lesson is important.
A drug may successfully inhibit its intended target and still fail to control the cancer if a downstream portion of the pathway remains permanently activated.
A simple gene list may not make that relationship obvious.
A pathway map can.
Cancer Pathway Mapping and Growth Signaling
Cancer pathway mapping takes the molecular alterations identified through comprehensive tumor profiling and places them into the biological pathways where they function.
This allows several additional questions to be considered.
Which major cancer pathways are altered?
Are several abnormalities occurring within the same pathway?
Is the mutation upstream or downstream from the proposed drug target?
Are two different signaling pathways reinforcing each other?
If one pathway is inhibited, does the cancer have another pathway through which it could continue growing?
These questions become particularly important when trying to understand drug resistance.
Cancer cells are biologically adaptable. Blocking one signaling pathway may suppress tumor growth temporarily, while another pathway becomes activated and allows the cancer to survive.
This phenomenon is sometimes called pathway compensation or bypass signaling.
Understanding these relationships is one reason combination therapy has become so important in modern oncology.
KEGG: A Biological Atlas of Cancer Pathways
One of the best known resources for studying cellular pathways is the KEGG pathway database.
KEGG stands for the Kyoto Encyclopedia of Genes and Genomes.
It contains biological pathway diagrams covering cellular signaling, metabolism, disease processes, drug activity, and many cancer related pathways.
A useful way to think about KEGG is as a biological atlas.
Genes and proteins appear at different positions within a pathway. Connections show how one molecule may activate, inhibit, or regulate another.
For example, KEGG maps can help illustrate how a signal travels from EGFR through RAS, RAF, MEK, and ERK before influencing activity within the nucleus.
They can also demonstrate how that pathway interacts with other major signaling networks such as PI3K, AKT, and mTOR.
KEGG is useful because scientists and clinicians can refer to a common framework when discussing these pathways.
But pathway maps also have limitations.
They are generalized models derived from accumulated scientific evidence. They are not a real time map of what is happening inside an individual patient’s tumor.
They also do not show precisely how strongly every pathway is functioning in that particular cancer.
Other important pathway resources include Reactome, WikiPathways, and the Molecular Signatures Database.
Major Cancer Pathways You May See on a Genomic Report
Several signaling systems appear repeatedly in cancer genomic testing.
RAS RAF MEK ERK Growth Signaling
The RAS RAF MEK ERK pathway is one of the major systems controlling cellular growth and proliferation.
Important genes within this pathway include:
KRAS
NRAS
BRAF
NF1
Alterations in these genes occur in several cancers, including colorectal cancer, melanoma, lung cancer, pancreatic cancer, and thyroid cancer.
BRAF V600 alterations are among the clearest examples of how pathway knowledge can lead directly to targeted therapy.
In several cancers, inhibition of BRAF alone may allow compensatory pathway activity to develop. This helped establish combination strategies that inhibit both BRAF and MEK.
PI3K AKT mTOR Signaling
Another major growth and survival pathway is PI3K AKT mTOR.
Important genes include:
PIK3CA
PTEN
AKT1
TSC1
TSC2
mTOR helps regulate cellular growth, protein synthesis, metabolism, and survival.
Loss of PTEN or activation of PIK3CA can increase signaling through this pathway.
Importantly, the PI3K AKT mTOR system also communicates with the RAS RAF MEK ERK pathway.
This cross talk helps explain why inhibiting one pathway can sometimes increase activity through another.
Blood Supply and Angiogenesis
A growing cancer requires oxygen and nutrients.
Tumors therefore develop mechanisms for stimulating new blood vessel formation, a process called angiogenesis.
One of the most important signaling molecules involved is vascular endothelial growth factor, or VEGF.
VEGF signaling became an important therapeutic target in oncology and led to drugs such as bevacizumab and several oral tyrosine kinase inhibitors.
Hypoxia signaling is closely connected to this process.
Important molecules include HIF 1 alpha and VHL.
VHL abnormalities are particularly important in clear cell renal cell carcinoma, where abnormal hypoxia signaling contributes to increased production of angiogenic factors.
Cancer Metabolism
Cancer cells frequently alter the way they generate and use energy.
One famous example is the Warburg effect, in which cancer cells may rely heavily on glycolysis even when oxygen is available.
Cancer metabolism is far more complicated than glucose metabolism alone, however.
Important metabolic regulators include MYC, AMPK, mTOR, and IDH1 and IDH2.
Mutated IDH enzymes provide a particularly interesting example.
Certain mutations in IDH1 or IDH2 cause the production of an abnormal metabolite called 2 hydroxyglutarate.
These mutations occur in several malignancies and have become therapeutic targets in diseases including acute myeloid leukemia and certain gliomas.
Pathway mapping helps show that genomic alterations can affect not only growth signaling but also the fundamental metabolism of a cancer cell.
Immune Evasion
A cancer must survive despite an immune system capable of recognizing abnormal cells.
Cancer pathway mapping can therefore include pathways involved in immune escape.
The PD 1 and PD L1 pathway is the most widely recognized example.
Cancer cells may use checkpoint signaling to suppress activated T cells. Immune checkpoint inhibitors can interfere with this mechanism and restore immune activity in selected cancers.
But PD 1 and PD L1 are only part of the story.
Other genes influence antigen presentation and immune recognition.
These include:
B2M
HLA related genes
JAK1
JAK2
Loss or dysfunction of these systems can interfere with the ability of immune cells to recognize and attack the tumor.
This helps explain why two cancers with apparently similar PD L1 findings may respond very differently to immunotherapy.
How Cancer Pathway Mapping Helps Explain Combination Therapy
One of the most useful applications of pathway mapping is understanding how cancer may escape from treatment.
Cancer treatment often begins by targeting a dominant driver.
The tumor may initially respond.
Over time, however, another signaling pathway may become active. A downstream mutation may emerge. A parallel pathway may take over. The cancer may therefore begin growing again despite continued inhibition of the original target.
Pathway mapping attempts to identify these potential escape routes.
This does not mean that every theoretically attractive drug combination should be used.
That would be a serious mistake.
Combination therapy must be supported by appropriate clinical evidence because combining drugs can substantially increase toxicity.
Pathway mapping should therefore be viewed as a way to generate and evaluate biological hypotheses, not as proof that a particular drug combination will benefit an individual patient.
Why Molecular Tumor Boards Matter
Modern genomic reports can contain numerous alterations.
Some have established treatment implications.
Others have uncertain significance.
Still others may matter only in the context of several additional abnormalities.
This is where a molecular tumor board may be particularly valuable.
A molecular tumor board brings together specialists who may include medical oncologists, molecular pathologists, geneticists, pharmacists, researchers, and other experts.
Instead of examining each gene in isolation, the team can evaluate the complete molecular pattern.
For example, four individually modest genomic abnormalities may become much more interesting if they all converge on the same biological pathway.
The purpose is not simply to find a drug that matches a gene.
The purpose is to understand the biology of the cancer.
Cancer Pathway Mapping Does Not Replace Clinical Evidence
This distinction is extremely important.
A pathway diagram can show that a drug theoretically interferes with an altered biological system.
That does not prove that the drug will help the patient.
Cancer treatment decisions must also consider the cancer type, stage, pathology, prior therapies, tumor burden, organ function, clinical trials, drug interactions, toxicity, and the strength of published clinical evidence.
Genomics gives us another layer of information.
It does not replace oncology.
The most useful interpretation combines the molecular information with the patient’s entire clinical picture.
Frequently Asked Questions
Do I need to understand cancer pathway mapping to make treatment decisions?
No.
You do not need to become a molecular biologist to participate in your care.
But understanding the basic concept can help you ask better questions about your genomic report and understand why an oncologist may recommend targeting one abnormality but not another.
Does my genomic report include pathway mapping?
Some comprehensive molecular reports organize findings according to signaling pathways or provide diagrams.
Others primarily list genomic alterations and associated therapies.
When interpretation becomes complicated, discussion with an oncologist familiar with molecular oncology or review through a molecular tumor board may provide additional context.
Can I look up my own mutations in KEGG?
Yes.
KEGG is publicly accessible, and you can search for individual genes to see the biological pathways in which they participate.
This can be useful educationally.
It should not be used by itself to select cancer treatment.
The meaning of a genomic alteration depends upon your cancer type, the specific variant, other genomic abnormalities, previous treatments, and the clinical evidence supporting a particular therapy.
The Bottom Line
Cancer pathway mapping changes the way we look at genomic information.
Instead of seeing fourteen unrelated gene abnormalities, we can begin to see a biological system.
We can identify which pathways control growth.
We can see where tumor suppressor mechanisms have been lost.
We can examine how the cancer handles metabolism.
We can study how it may escape immune attack.
And we can begin to understand how one pathway may allow the tumor to survive when another pathway is blocked.
The genomic report provides the pieces.
Cancer pathway mapping helps show how those pieces fit together.
Educational Disclaimer
This article is provided for cancer education only. It is not medical advice and does not establish a physician patient relationship. Genomic findings and pathway analysis should not be used independently to select, discontinue, or combine cancer treatments. Treatment decisions should be discussed with your treating oncologist and interpreted in the context of your specific diagnosis, pathology, molecular findings, medical history, and overall clinical condition.
References
- Kanehisa M, Goto S. KEGG: Kyoto Encyclopedia of Genes and Genomes. Nucleic Acids Research. 2000;28(1):27 to 30.
- Kanehisa M, Furumichi M, Sato Y, et al. KEGG for taxonomy based analysis of pathways and genomes. Nucleic Acids Research. 2023;51(D1):D587 to D592.
- Sanchez Vega F, Mina M, Armenia J, et al. Oncogenic signaling pathways in The Cancer Genome Atlas. Cell. 2018;173(2):321 to 337.
- Hanahan D. Hallmarks of cancer: new dimensions. Cancer Discovery. 2022;12(1):31 to 46.
- Karapetis CS, Khambata Ford S, Jonker DJ, et al. K ras mutations and benefit from cetuximab in advanced colorectal cancer. New England Journal of Medicine. 2008;359(17):1757 to 1765.
- Long GV, Stroyakovskiy D, Gogas H, et al. Combined BRAF and MEK inhibition versus BRAF inhibition alone in melanoma. New England Journal of Medicine. 2014;371(20):1877 to 1888.
- Zaretsky JM, Garcia Diaz A, Shin DS, et al. Mutations associated with acquired resistance to PD 1 blockade in melanoma. New England Journal of Medicine. 2016;375(9):819 to 829.
- Liberzon A, Birger C, Thorvaldsdóttir H, et al. The Molecular Signatures Database hallmark gene set collection. Cell Systems. 2015;1(6):417 to 425.